MetVue Mark II
The UCD Meteorological Visualization System
[VERSION 2. September 2009]
MetVue is a system for displaying real-time meteorological data on the
UCD campus. The data are displayed on large LCD screens in SERC-North
(Physics Building) and on the top floor of the Science Hub.
An upgraded version of the system,
MetVue Mark II,
was introduced on 1 September, 2009.
The following types of data are presented in an automatically repeating
animation loop:
- Satellite data (provided by Met Éireann)
- Radar data (provided by Met Éireann)
- Forecast charts (from www.ogimet.com)
The complete loop takes about 2 minutes. Details about each of the
products are given below.
|
I. High-Resolution Visual Images
|
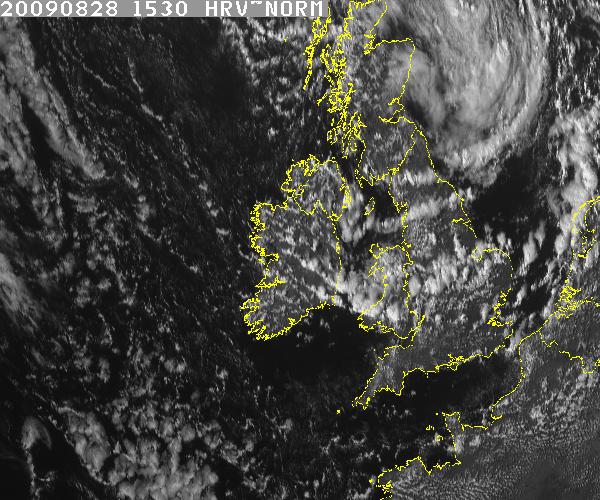
High-Resolution Visual (HRV) images from Meteosat (provided courtesy
of Met Éireann) over an area surrounding Ireland. A sequence
of 24 images covers the past 6 hours.
Note that, as the visual channel contains no information during the
hours of darkness, the night-time images are excluded.
The sequence is updated every 15 minutes.
The time of each image (UTC) is shown in the top left corner.
[Click image to display larger version],
|
II. Water-Vapour Images
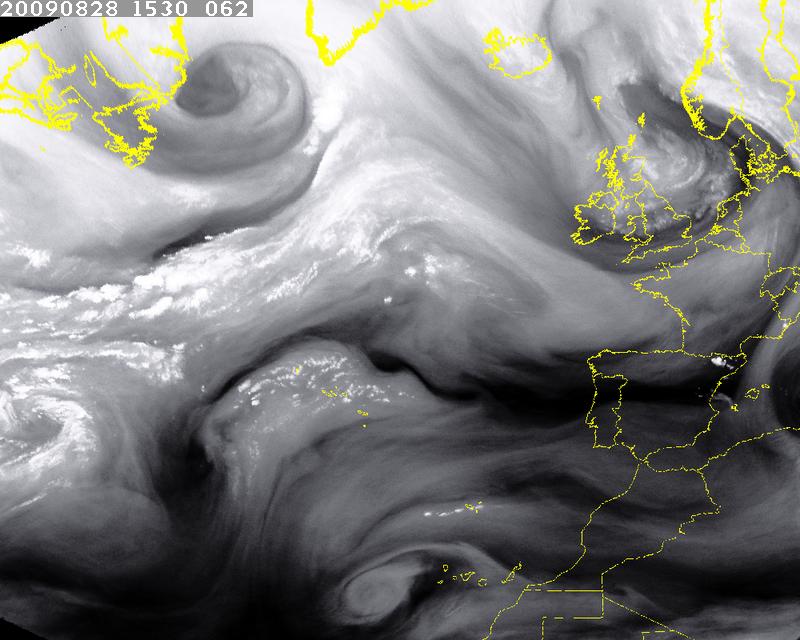
Water-Vapour (WV) images from Meteosat (provided courtesy
of Met Éireann) over the North Atlantic area. A sequence
of 24 images at 15 minute intervals covers the past 6 hours.
These images contain useful information during both day and night.
The WV image indicates the level of water vapour in the upper troposphere,
and shows the broad synoptic features of the atmospheric circulation.
The sequence is updated every 15 minutes.
The time of each image (UTC) is shown in the top left corner.
|
|
III. Radar Images
|
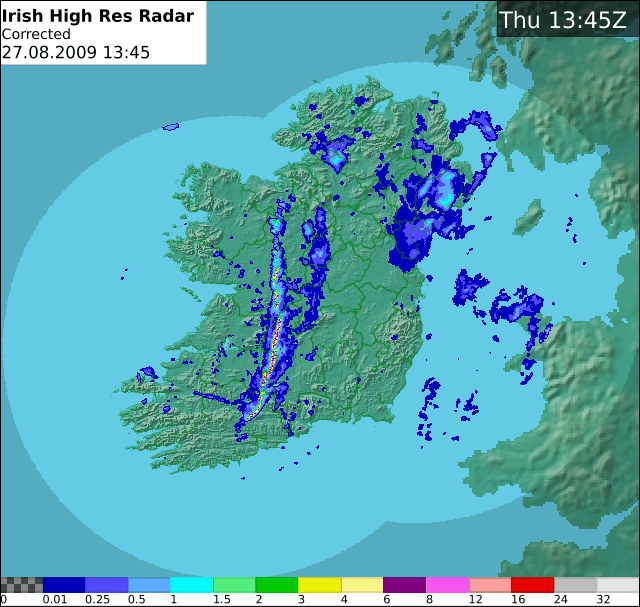
These are composite images from the Met Éireann weather
radars at Dublin Airport and Shannon Airport.
A sequence of 24 images covers the past 6 hours with a 15 minute interval.
Radar echo intensities are converted to equivalent rainfall rates in
mm/hr (see scale at bottom of image).
These images are corrected to remove spurious (RLAN) interference.
The example (left) shows a squall-line east of Galway and Limerick.
The sequence is updated every 15 minutes.
Date: top left. Time (UTC): top right.
|
IV. Forecast Charts
These charts are obtained from http://www.ogimet.com.
They are based on forecasts using the global GFS spectral model
of the National Centers for Environmental Prediction (NCEP) in Washington.
The parameters shown on the charts are:
- Sea level pressure (hPa, black contours).
- Surface wind speeds > 15 kts (arrows)
- Cloud cover (%, grey shading)
- Rainfall (mm/6h, coloured shading)
- 1000-500 hPa thickness (dam, coloured lines)
The charts show the predicted development at six-hour intervals over the coming
three days. They are updated every twelve hours.
|
|
V. Other Products
Additional data will be included as the system develops. We plan to
include short-range forecasts from the COSMO model which is run at UCD.
The older version of MetVue (Mark I) is described
here.
Comments on MetVue are welcome, to Peter.Lynch •AT• ucd.ie please.
[Version 2, September, 2009]
|